Profesjonalne wykresy.
W kilka sekund.
Przestań zmagać się ze skomplikowanymi narzędziami BI. Super BI błyskawicznie zmienia surowe dane w oszałamiające wizualizacje gotowe do prezentacji. Najszybszy sposób na dzielenie się spostrzeżeniami i podejmowanie decyzji opartych na danych w Twoim zespole.
Join top teams from SaaS & Fintech waiting for the future of BI.
Jeden obszar roboczy dla danych,
inteligencji i storytellingu
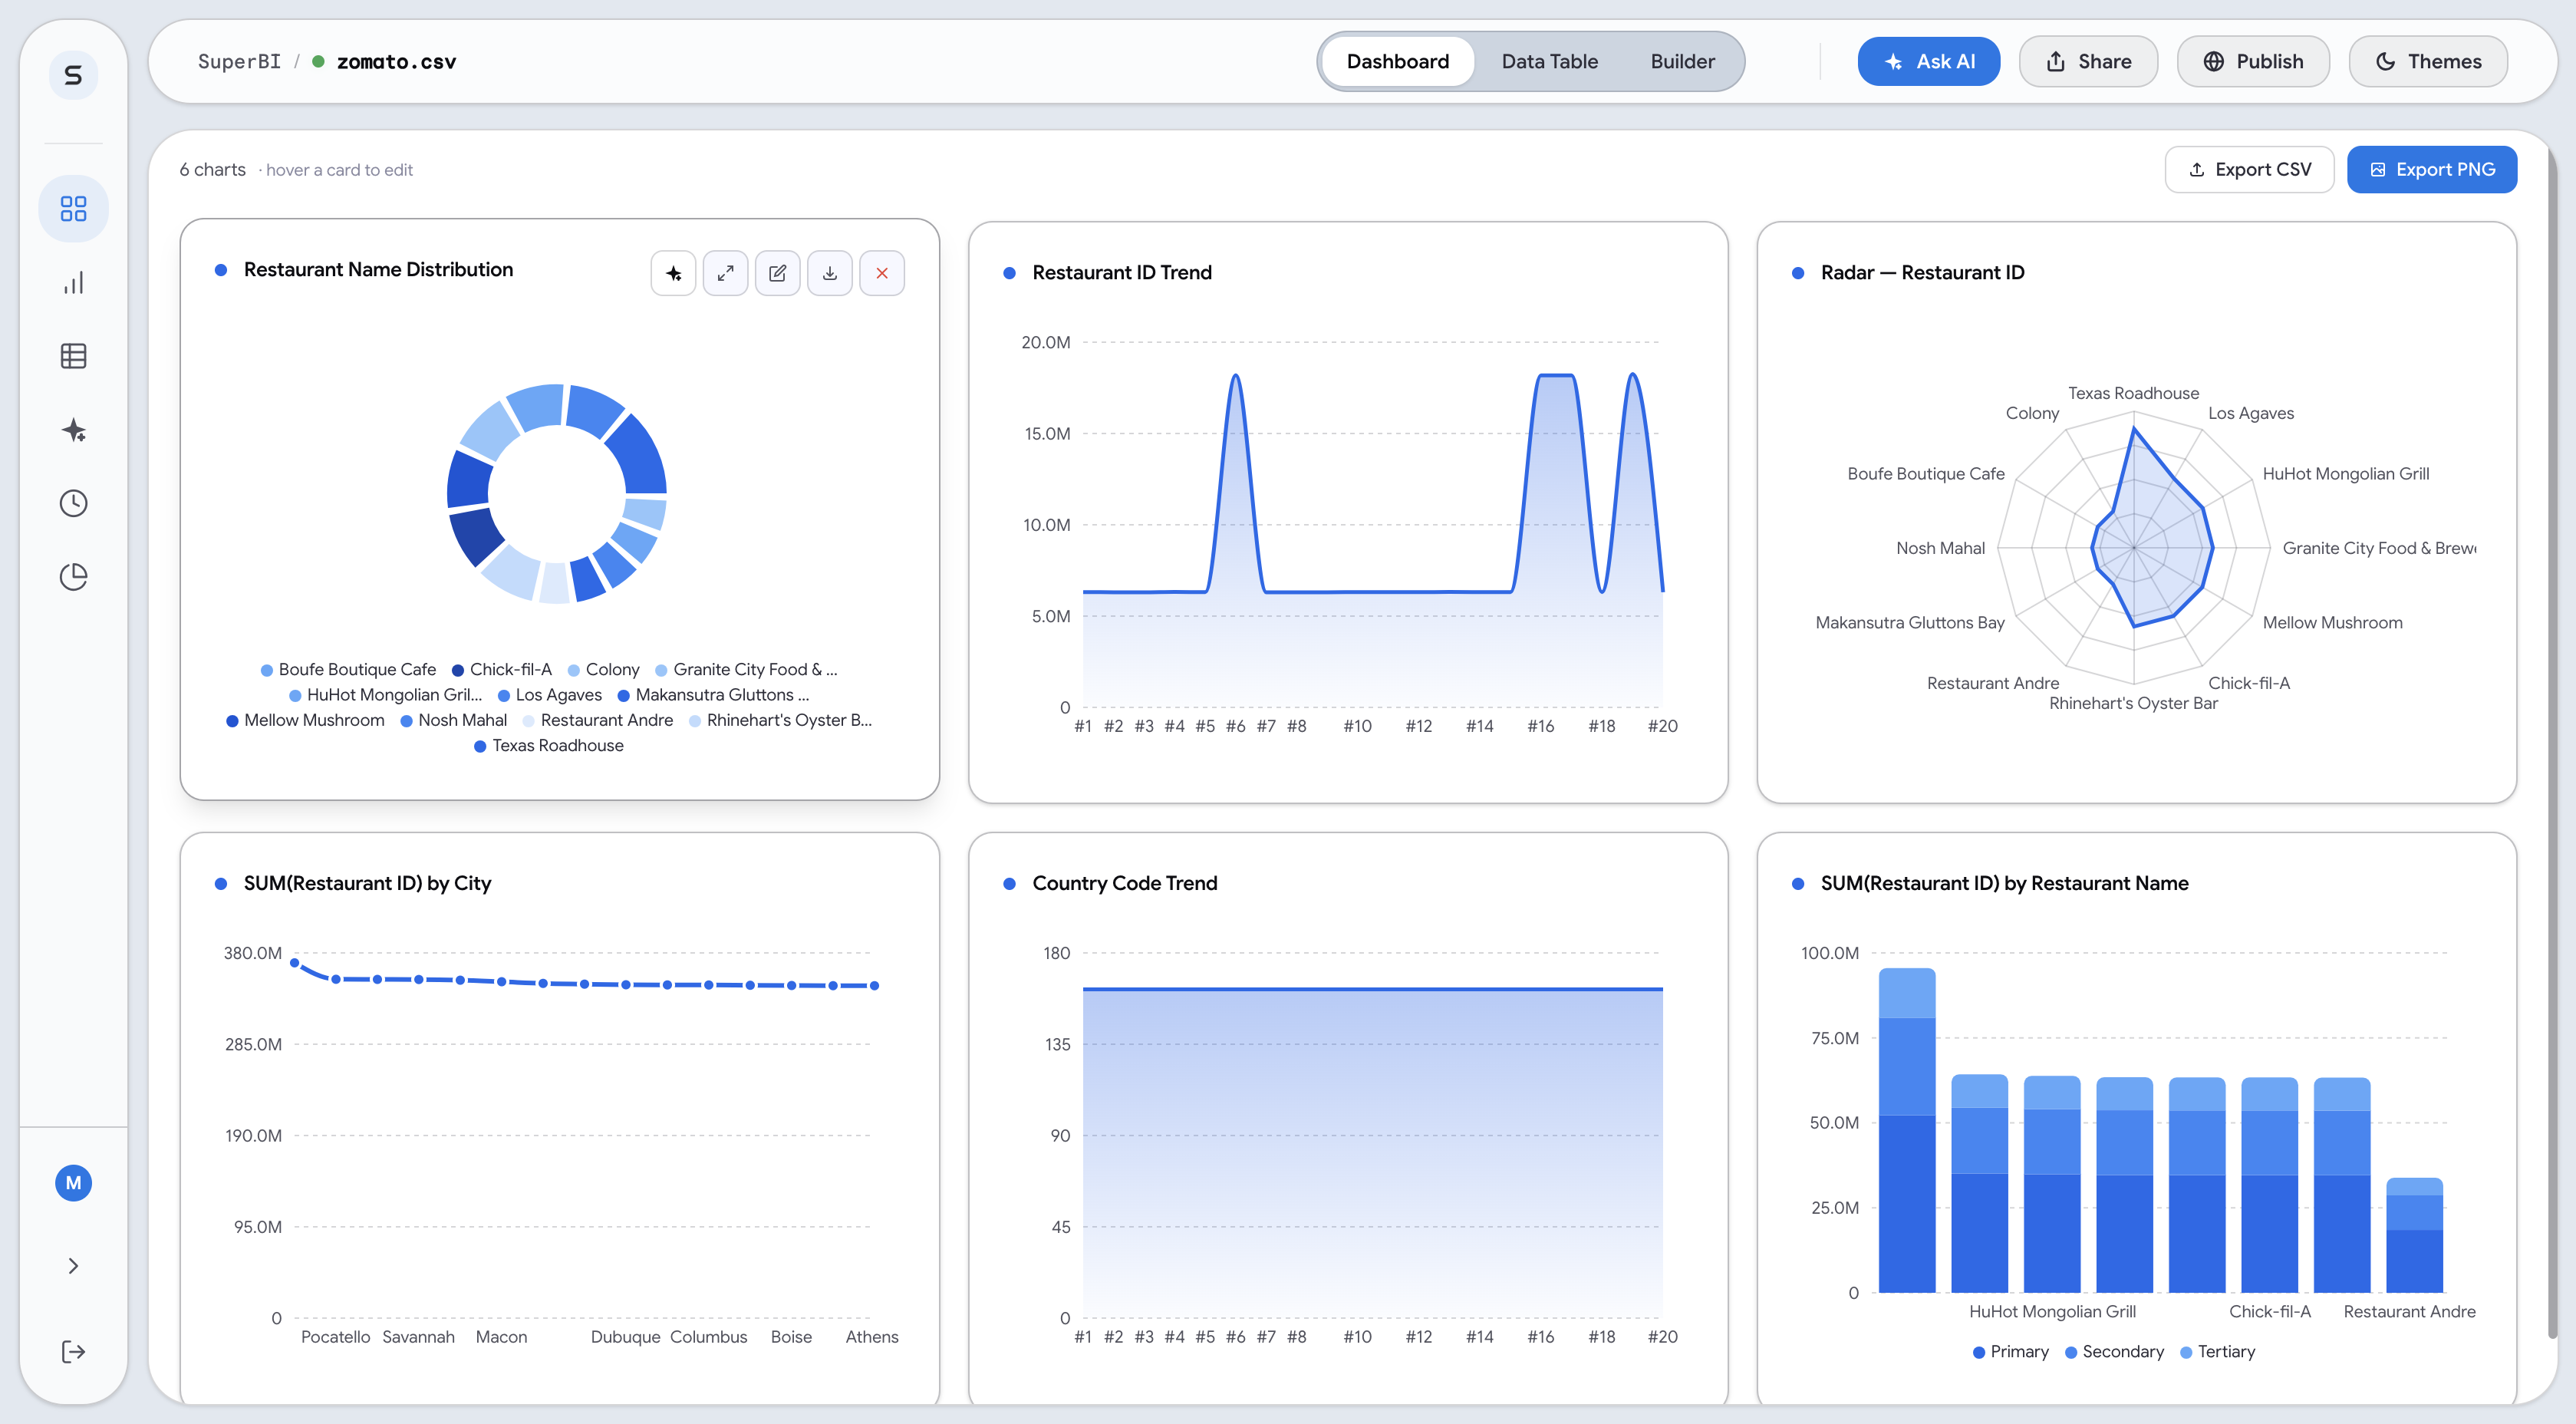
Super BI łączy wszystko, czego potrzebują zespoły danych. Połącz swoje źródła danych. Twórz i udostępniaj profesjonalne wykresy swojemu zespołowi. Kontroluj dokładność zestawów danych. Generuj nowe spostrzeżenia za pomocą czatu AI. Wszystko w jednym czystym, szybkim obszarze roboczym.
Stworzone dla nowoczesnych procesów pracy z danymi
Wszystko, czego potrzebujesz, aby w kilka sekund zamienić surowe dane w profesjonalne spostrzeżenia.
Stworzone dla każdego zespołu i przepływu pracy
Super BI pozwala każdemu — od startupów po korporacje — natychmiast znajdować spostrzeżenia w swoich danych.
Według branży
Financial Services
Turn financial data into dashboards fast. Analyze market trends and portfolio performance with AI insights on the fly.
Learn moreEducation
Empower educators to visualize performance. Transform enrollment data into actionable growth strategies effortlessly every day.
Healthcare
Bridge the gap between data and insights. Build secure, compliant dashboards to monitor health outcomes in real-time.
Government
Modernize agency reporting with portals. Improve transparency with data visualizations for public policy impact instantly.
Retail
Optimize inventory and sales performance. Identify top-selling products and customer behavior patterns with ease.
Manufacturing
Track production efficiency and health. Predict equipment maintenance needs using advanced data exploration tools.
Real Estate
Visualize property market values today. Share professional market analysis dashboards with clients in one simple click.
Technology
Scale reporting across engineering teams. Track feature adoption and system uptime with zero manual setup required.
Według zespołu
Sales
Impress stakeholders with real-time reports. Uncover win rates and territory performance using natural language queries.
Learn moreMarketing
Connect data to measure ROI instantly. Visualize customer acquisition costs and conversion funnels without an analyst.
Learn moreHR & People
Analyze diversity and retention insights. Build internal dashboards to track hiring goals and team performance metrics.
Finance
Transform balance sheets into stories. Automate monthly variance reports and budget tracking for every department.
Support
Turn ticket data into insights fast. Identify common pain points and resolution times to improve team efficiency.
Operations
Build dashboards to monitor logistics. Scale your processes with data-driven insights that anyone on the team can use.
IT & Dev
Monitor health and deployment metrics. Centralize log data into professional charts for better team visibility.
Construction
Monitor project timelines and costs. Stay under budget with real-time tracking of material expenses and resources across sites.
Według rozmiaru
Startups
Skip the expensive data team today. Scale your reporting as your product grows with flexible, AI-first dashboards.
Learn moreSmall Business
Get enterprise reports without technicality. Manage your business with data-driven confidence using simple tools.
Mid-Market
Professionalize reporting across teams. Connect all your data sources and find correlations across the company.
Enterprise
Scale to thousands with security. Maintain visual consistency and data governance across global teams effortlessly.
Enterprise Security
Bank-grade AES-256 encryption for all data at rest and in transit. SOC2 Type II compliant infrastructure.
Leader in AI BI
Rated #1 High Performer on G2 for Autonomous Business Intelligence and AI Data Visualization in 2026.
Global Infrastructure
Data centers across 12 regions. Local data residency options for US, EU, and APAC enterprise customers.
Prosty, przejrzysty cennik
Zacznij za darmo i skaluj swoje wizualizacje wraz ze wzrostem danych. Brak ukrytych opłat.
Free
Pro
Growth
Dlaczego Super BI?
Tradycyjne narzędzia BI zostały zbudowane dla analityków danych. Super BI jest zbudowany dla całego zespołu.
Tradycyjne narzędzia
Power BI, Tableau, Excel
- ✕
Stroma krzywa uczenia się
Wymaga szkolenia technicznego i ręcznej konfiguracji każdego pulpitu nawigacyjnego.
- ✕
Odizolowane przygotowanie danych
Dane muszą być ręcznie czyszczone i strukturyzowane przed wizualizacją.
- ✕
Statyczne raporty
Pulpity nawigacyjne często wymagają ręcznego odświeżania i nie współpracują w czasie rzeczywistym.
- ✕
Wysoka zależność od analityków
Zespoły czekają dniami, aż analitycy zbudują lub zaktualizują konkretne widoki.
- ✕
Generyczna estetyka projektu
Standardowe wykresy, które wymagają dodatkowych narzędzi do uzyskania jakości gotowej do prezentacji.
- ✕
Rozproszone udostępnianie plików
Udostępnianie wymaga eksportowania plików PDF lub przesyłania dużych, statycznych plików.
Inteligencja Super BI
Zasilane przez autonomiczną sztuczną inteligencję
- ✓
Zerowa krzywa uczenia się
Twórz profesjonalne wykresy natychmiast za pomocą poleceń w języku naturalnym.
- ✓
Autonomiczne przygotowanie danych
Sztuczna inteligencja automatycznie podsumowuje, czyści i strukturyzuje zestawy danych.
- ✓
Współpraca na żywo
Każdy pulpit nawigacyjny jest domyślnie aktywny i umożliwia współpracę całemu zespołowi.
- ✓
Natychmiastowy wgląd w dane w trybie samoobsługowym
Każdy może uzyskać odpowiedzi w kilka sekund bez czekania na zespół ds. danych.
- ✓
Polerowanie wizualne klasy studyjnej
Estetyka gotowa do prezentacji prosto z pudełka, bez konieczności dodatkowej pracy projektowej.
- ✓
Linki do współpracy w czasie rzeczywistym
Udostępniaj aktywne, interaktywne linki, które pozostają aktualne wraz ze zmianą danych.
Got Questions? We've Got Answers
Everything you need to know about Super BI and how it can transform your data workflow.
Loved by the best teams
Join 10,000+ data-driven companies visualizing the future with Super BI.
"Super BI transformed our monthly board reports. What used to take two days of manual Excel work now takes literally seconds. The AI's ability to clean raw CSVs is magic."
Sarah Thompson
Head of Finance · Series B Fintech
"We replaced our complex Tableau setup with Super BI for our non-technical managers. Now they build their own charts without opening a Jira ticket for our data team."
Michael Chen
Data Lead · Global Logistics Co.
"The autonomous anomalies detection found a $12k billing error in our stripe data that we had missed for months. It paid for itself in the first 10 minutes."
Emily Rodriguez
COO · Fast-Growth SaaS
"I've tried every BI tool out there. Super BI is the first one that actually understands context. It doesn't just draw charts; it explains what the data means."
David Patel
Founder · Analytics Studio
"I can finally see our CAC and LTV trends across 5 different platforms in one view. Super BI's cross-dataset merging is the best I've ever used."
Olivia Harper
Marketing Director · Consumer Brand
"The security features are what won us over. Having SOC2 compliance and enterprise-grade encryption for our sensitive data was non-negotiable."
James Carter
VP Operations · Enterprise Retail
"Visualizing our user engagement metrics is now a breeze. The board-ready export feature makes my weekly presentations look like they were made by a pro designer."
Sophia Lee
Product Manager · NextGen AI
"Super BI is a force multiplier for our team. We've cut down reporting time by 90%, allowing us to focus on actual strategy instead of data entry."
Alex Rivera
Financial Analyst · Capital Partners
Gotowy na transformację swoich danych?
Every dataset you upload from now on comes with full AI intelligence. Know what happened, why it happened, and exactly what to do next.
No credit card required. GDPR compliant. Global data centers.