Grafici professionali.
Creati in pochi secondi.
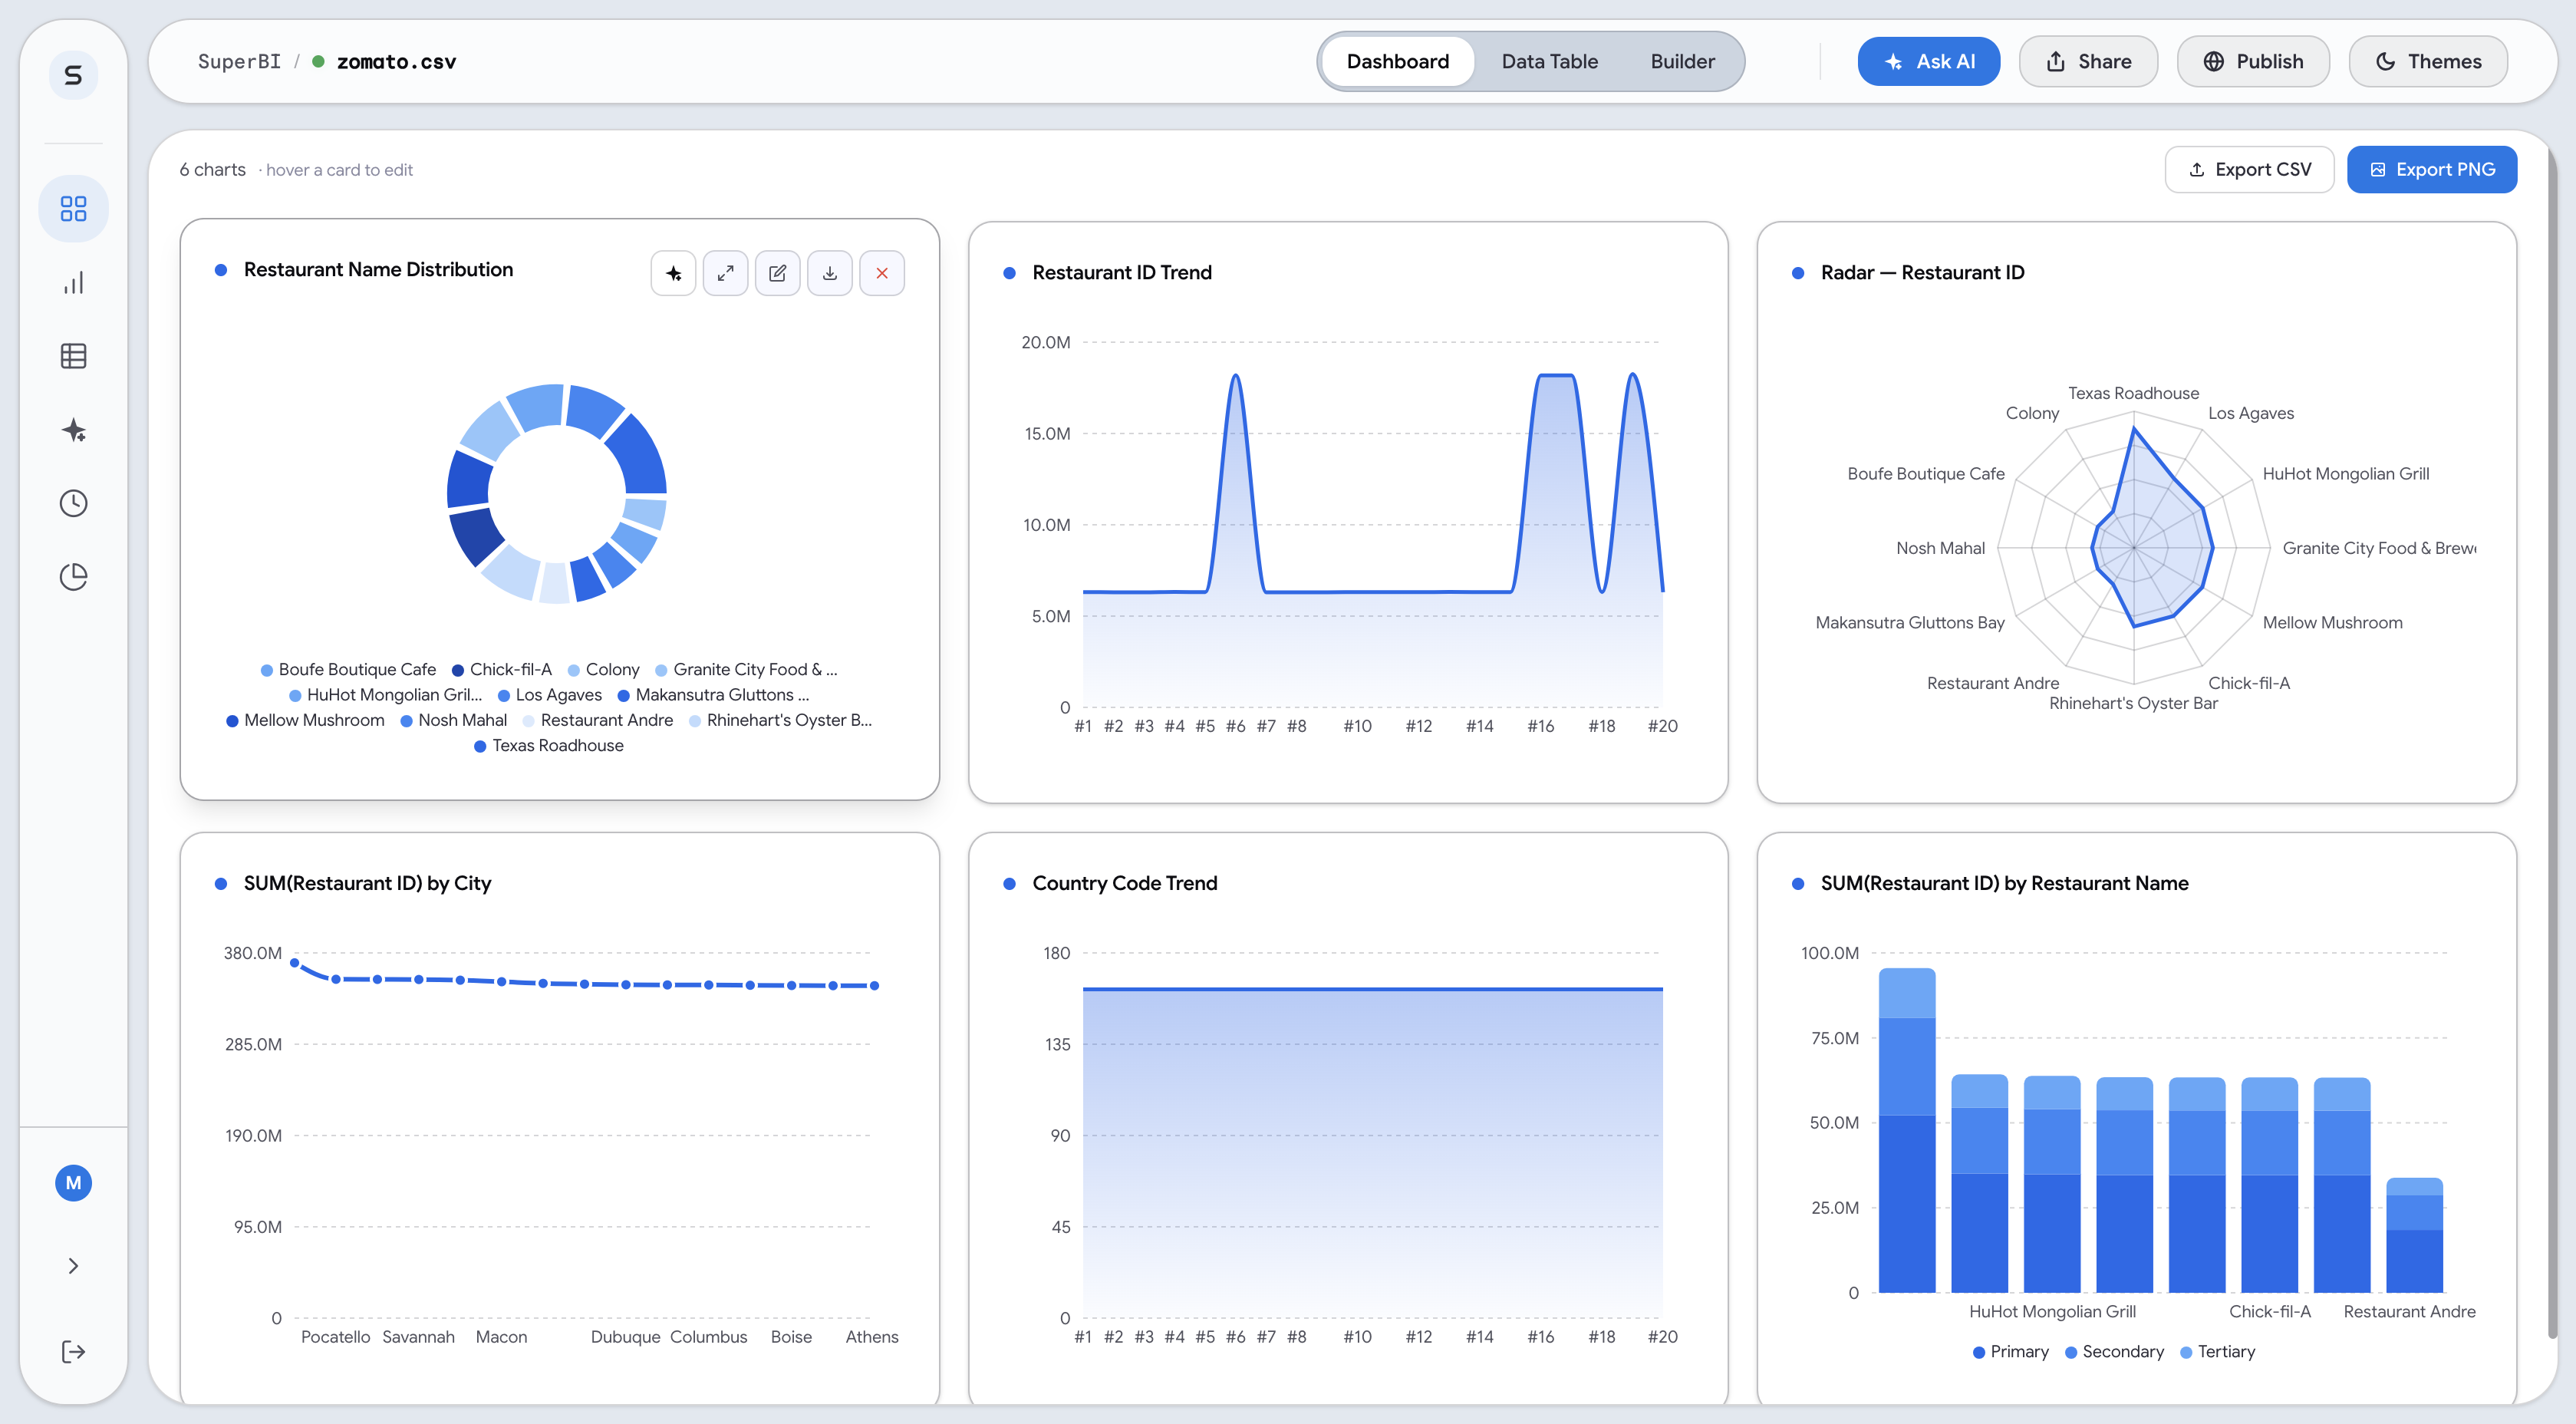
Smetti di lottare con strumenti di BI complessi. Super BI trasforma istantaneamente i tuoi dati grezzi in visualizzazioni straordinarie e pronte per il consiglio di amministrazione. Il modo più veloce per condividere intuizioni e prendere decisioni basate sui dati con il tuo team.
Join top teams from SaaS & Fintech waiting for the future of BI.
Uno spazio di lavoro per i dati,
l'intelligenza e lo storytelling
Super BI riunisce tutto ciò di cui i team di dati hanno bisogno. Connetti le tue fonti di dati. Crea e condividi grafici professionali con il tuo team. Verifica l'accuratezza dei set di dati. Genera nuove intuizioni con la chat AI. Tutto in uno spazio di lavoro pulito e veloce.
Costruito per i moderni flussi di lavoro dei dati
Tutto ciò di cui hai bisogno per trasformare i dati grezzi in approfondimenti professionali in pochi secondi.
Costruito per ogni team e flusso di lavoro
Super BI consente a tutti, dalle startup alle imprese, di trovare istantaneamente approfondimenti nei propri dati.
Per settore
Financial Services
Turn financial data into dashboards fast. Analyze market trends and portfolio performance with AI insights on the fly.
Learn moreEducation
Empower educators to visualize performance. Transform enrollment data into actionable growth strategies effortlessly every day.
Healthcare
Bridge the gap between data and insights. Build secure, compliant dashboards to monitor health outcomes in real-time.
Government
Modernize agency reporting with portals. Improve transparency with data visualizations for public policy impact instantly.
Retail
Optimize inventory and sales performance. Identify top-selling products and customer behavior patterns with ease.
Manufacturing
Track production efficiency and health. Predict equipment maintenance needs using advanced data exploration tools.
Real Estate
Visualize property market values today. Share professional market analysis dashboards with clients in one simple click.
Technology
Scale reporting across engineering teams. Track feature adoption and system uptime with zero manual setup required.
Per team
Sales
Impress stakeholders with real-time reports. Uncover win rates and territory performance using natural language queries.
Learn moreMarketing
Connect data to measure ROI instantly. Visualize customer acquisition costs and conversion funnels without an analyst.
Learn moreHR & People
Analyze diversity and retention insights. Build internal dashboards to track hiring goals and team performance metrics.
Finance
Transform balance sheets into stories. Automate monthly variance reports and budget tracking for every department.
Support
Turn ticket data into insights fast. Identify common pain points and resolution times to improve team efficiency.
Operations
Build dashboards to monitor logistics. Scale your processes with data-driven insights that anyone on the team can use.
IT & Dev
Monitor health and deployment metrics. Centralize log data into professional charts for better team visibility.
Construction
Monitor project timelines and costs. Stay under budget with real-time tracking of material expenses and resources across sites.
Per dimensione
Startups
Skip the expensive data team today. Scale your reporting as your product grows with flexible, AI-first dashboards.
Learn moreSmall Business
Get enterprise reports without technicality. Manage your business with data-driven confidence using simple tools.
Mid-Market
Professionalize reporting across teams. Connect all your data sources and find correlations across the company.
Enterprise
Scale to thousands with security. Maintain visual consistency and data governance across global teams effortlessly.
Enterprise Security
Bank-grade AES-256 encryption for all data at rest and in transit. SOC2 Type II compliant infrastructure.
Leader in AI BI
Rated #1 High Performer on G2 for Autonomous Business Intelligence and AI Data Visualization in 2026.
Global Infrastructure
Data centers across 12 regions. Local data residency options for US, EU, and APAC enterprise customers.
Prezzi semplici e trasparenti
Inizia gratuitamente e scala le tue visualizzazioni man mano che i tuoi dati crescono. Nessun costo nascosto.
Free
Pro
Growth
Perché Super BI?
Gli strumenti BI tradizionali sono stati creati per gli analisti di dati. Super BI è creato per l'intero team.
Strumenti tradizionali
Power BI, Tableau, Excel
- ✕
Curva di apprendimento ripida
Richiede formazione tecnica e configurazione manuale per ogni dashboard.
- ✕
Preparazione dei dati isolata
I dati devono essere puliti e strutturati manualmente prima della visualizzazione.
- ✕
Report statici
Le dashboard richiedono spesso aggiornamenti manuali e non sono collaborative in tempo reale.
- ✕
Forte dipendenza dagli analisti
I team attendono giorni affinché gli analisti creino o aggiornino viste specifiche.
- ✕
Estetica del design generica
Grafici standard che richiedono strumenti extra per una qualità pronta per la presentazione.
- ✕
Condivisione file frammentata
La condivisione richiede l'esportazione di PDF o l'invio di file statici di grandi dimensioni.
Intelligenza Super BI
Alimentato da IA autonoma
- ✓
Curva di apprendimento zero
Crea grafici professionali istantaneamente utilizzando prompt in linguaggio naturale.
- ✓
Preparazione dei dati autonoma
L'IA riassume, pulisce e struttura automaticamente i tuoi set di dati.
- ✓
Collaborazione dal vivo
Ogni dashboard è dal vivo e collaborativa per impostazione predefinita per l'intero team.
- ✓
Insight istantanei self-service
Chiunque può ottenere risposte in pochi secondi senza attendere un team di dati.
- ✓
Finitura visiva di qualità studio
Estetica pronta per la presentazione fin da subito, nessun lavoro di progettazione extra richiesto.
- ✓
Link collaborativi in tempo reale
Condividi link interattivi dal vivo che rimangono aggiornati al variare dei dati.
Got Questions? We've Got Answers
Everything you need to know about Super BI and how it can transform your data workflow.
Loved by the best teams
Join 10,000+ data-driven companies visualizing the future with Super BI.
"Super BI transformed our monthly board reports. What used to take two days of manual Excel work now takes literally seconds. The AI's ability to clean raw CSVs is magic."
Sarah Thompson
Head of Finance · Series B Fintech
"We replaced our complex Tableau setup with Super BI for our non-technical managers. Now they build their own charts without opening a Jira ticket for our data team."
Michael Chen
Data Lead · Global Logistics Co.
"The autonomous anomalies detection found a $12k billing error in our stripe data that we had missed for months. It paid for itself in the first 10 minutes."
Emily Rodriguez
COO · Fast-Growth SaaS
"I've tried every BI tool out there. Super BI is the first one that actually understands context. It doesn't just draw charts; it explains what the data means."
David Patel
Founder · Analytics Studio
"I can finally see our CAC and LTV trends across 5 different platforms in one view. Super BI's cross-dataset merging is the best I've ever used."
Olivia Harper
Marketing Director · Consumer Brand
"The security features are what won us over. Having SOC2 compliance and enterprise-grade encryption for our sensitive data was non-negotiable."
James Carter
VP Operations · Enterprise Retail
"Visualizing our user engagement metrics is now a breeze. The board-ready export feature makes my weekly presentations look like they were made by a pro designer."
Sophia Lee
Product Manager · NextGen AI
"Super BI is a force multiplier for our team. We've cut down reporting time by 90%, allowing us to focus on actual strategy instead of data entry."
Alex Rivera
Financial Analyst · Capital Partners
Pronto a trasformare i tuoi dati?
Every dataset you upload from now on comes with full AI intelligence. Know what happened, why it happened, and exactly what to do next.
No credit card required. GDPR compliant. Global data centers.